A summary of the list of recommendations on the implementation of the OBBBA in Colorado regarding public benefits systems and work requirements.
Recent articles
CCLP testifies in support of Colorado’s AI Sunshine Act
Charles Brennan provided testimony in support of Senate Bill 25B-004, Increase Transparency for Algorithmic Systems, during the 2025 Special Session. CCLP is in support of SB25B-004.
Coloradans launch 2026 ballot push for graduated state income tax
New ballot measure proposals would cut taxes for 98 percent of Coloradans, raise revenue to address budget crisis.
CCLP statement on the executive order and Colorado’s endless budget catastrophe
Coloradans deserve better than the artificial budget crisis that led to today's crippling cuts by Governor Jared Polis.
Poverty decreased statewide, but increased in parts of Colorado

You may have missed it with the end-of-the-year hustle and bustle, but the U.S. Census Bureau released its latest county-level estimates for 2018 on Dec. 19, 2019. The data, which provides a socio-economic snapshot of the state and its counties, allows us to see how the economic security of Coloradans has changed between 2017 and 2018.
The poverty rate is one of the primary indicators that CCLP considers for its semiannual State of Working Colorado compendium (a 2020 version of the report is in the works). While the number changes depending on which survey you reference, the data released in December show that 10.9 percent of Colorado residents lived below the poverty level in 2018. This is lower than 2017 when 11.5 percent of Coloradans lived in poverty. Overall, the Census Bureau estimates over 21,600 fewer Coloradans lived in poverty in 2018 compared to 2017 — a decrease of 3.5 percent. This is a great achievement that should be celebrated.
There’s more to the story…
However, as with most statistics one sees in the news about the economy, this headline does not tell the full story of who is struggling to get by in our state. To understand why this is the case, it is important understand what we mean when we talk about the poverty rate. In the United States, poverty is defined by the federal government as the income needed to cover three-times the costs of a minimum food diet in 1963, adjusted for inflation and family size. In other words, poverty is measured based on a methodology that has not fundamentally changed in over 50 years, other than to account for changes in the cost of living. This approach to measuring poverty assumes that three times the cost of a minimum food diet in 1963 is enough income for a family or household to be economically secure and self-sufficient in 2018. Furthermore, the poverty level set by the federal government is the same across all 48 states in the contiguous United States and does not adjust to reflect variations in the cost of living across the country, let alone within a state.
In order to create a more accurate picture of who is struggling economically in our state, CCLP works with the University of Washington to publish the Self-Sufficiency Standard report that measures a household’s income needs by looking at the actual costs of housing, food, health care, transportation, child care and other expenses in every county in Colorado. This “budget” is further adjusted by family type, so that it can accurately account for how expenses vary among Colorado’s diverse families. For example, a family of two would have had to have earned at least $16,460 in 2018 to be considered above the poverty level. Depending on the county, a family consisting of one adult and one preschooler would have needed to earn anywhere between $24,499 (if living in Baca County) and $71,274 (if living in Pitkin County) in 2018 to cover their basic needs according to the Standard. This broad range of needed income illustrates the importance of taking local cost of living into account when discussing Coloradans’ economic security.
The Self-Sufficiency Standard also shows a very different picture of economic need in Colorado. For instance, 8.4 percent of working-age families in Colorado (households with at least one member between the ages of 18 and 64 with no work-limiting disability) were below the poverty level in 2016, compared to 27.4 percent who were below the Self-Sufficiency Standard (2016 incomes were inflated to 2018 dollars in order to compare them to the Self-Sufficiency Standard). In other words, nearly 300,000 households in the state earn enough income to be above the poverty level, but still do not earn enough to cover the essential goods and services they need to get by. Why does the poverty measure used by the federal government undercount economic need by so much? Looking across all the family budgets calculated for the Self-Sufficiency Standard (719 family types x 64 counties), food accounts for an average of 17.3 percent of the total monthly costs faced by families, not 33 percent as assumed in the official poverty measure. In other words, the official poverty measure over-estimates the share of money in a family’s monthly budget that goes towards food while under-estimating the share that goes to other expenses, such as housing or health care.
Poverty increases in many counties
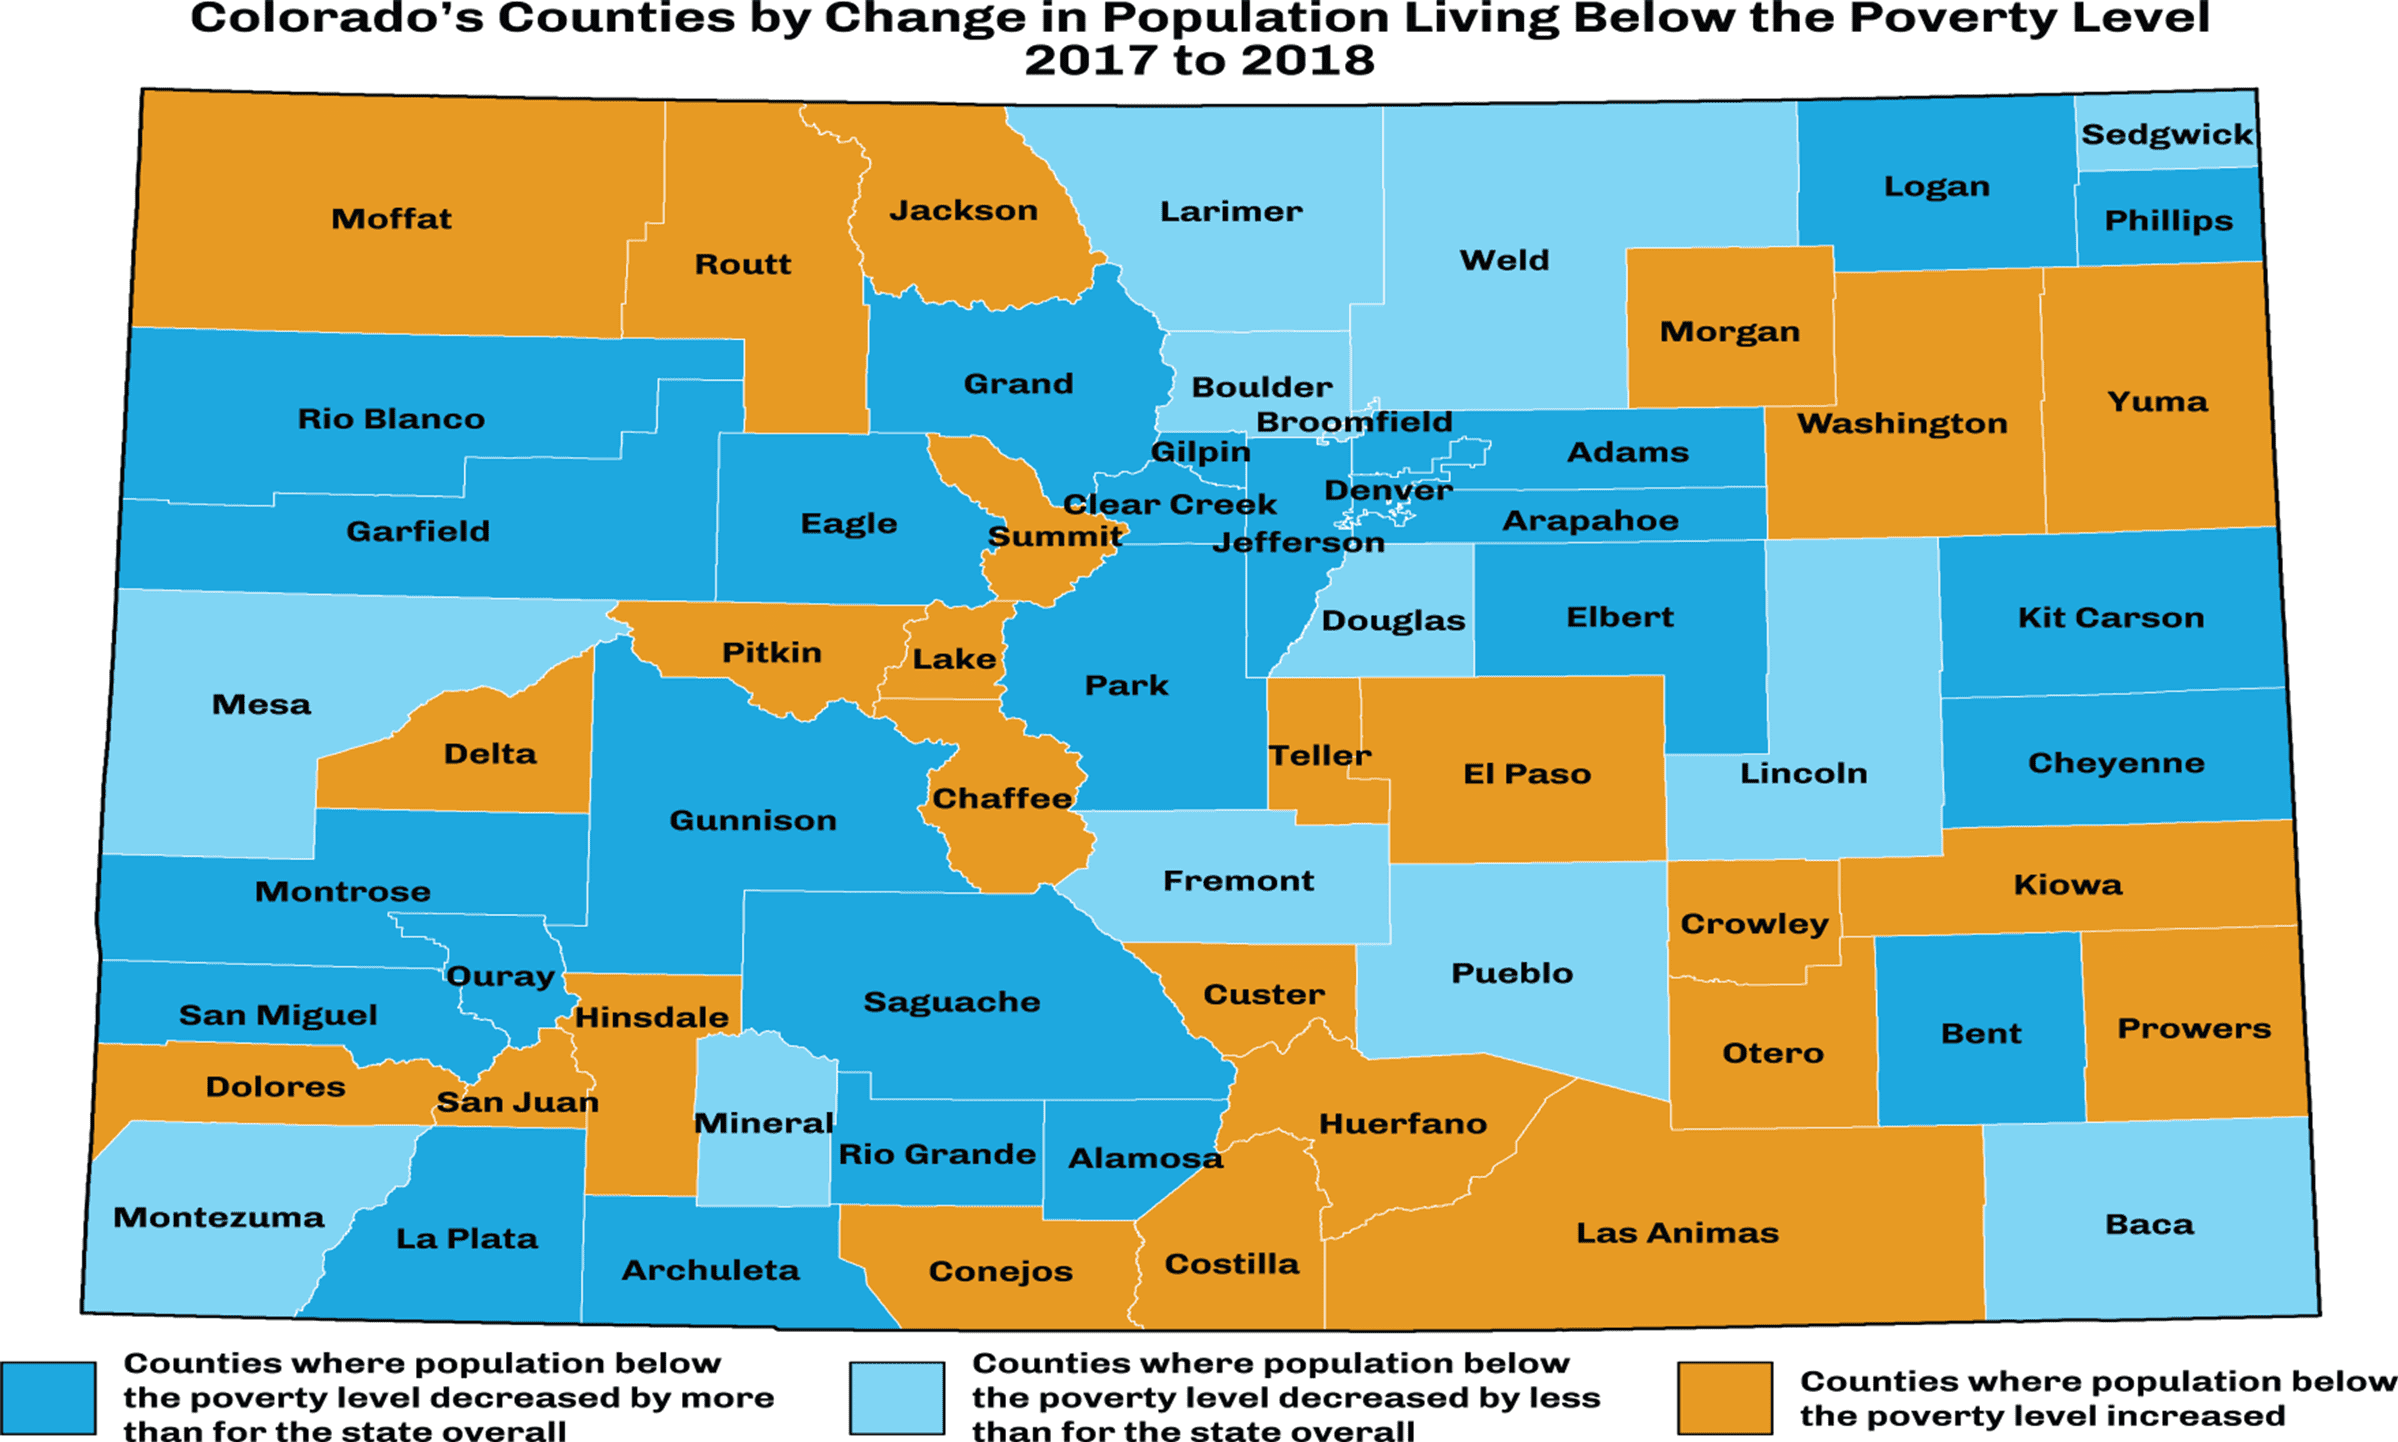
When talking about poverty in Colorado, it is also important to remember that economic opportunity is not equally distributed across our state. This latest release from the U.S. Census Bureau allows us to examine how poverty rates have changed in each of Colorado’s 64 counties. According to the American Community Survey, poverty rates varied tremendously across Colorado in 2018. Douglas County had the lowest rate (3.5 percent) while Costilla County had the highest rate (at 30.1 percent). In all, 38 counties had poverty rates higher than the rate for the state (10.9 percent).
While the state’s poverty rate declined between 2017 and 2018, this decline was not uniform across all counties. 23 counties saw their poverty rate increase. In addition, 25 counties saw an increase in the total number of people living below the poverty level. But it’s not all bad news: 26 counties saw their poverty rates decline by more than the decline seen in the state. These county-level statistics demonstrate why we need to be cautious when looking at state-level economic data, which often masks these local trends.
As we move into the 2020 legislative session, this data reminds us of two crucial points:
- While some might argue that the booming state economy means we don’t need to expand social safety net programs or that we can cut them altogether, there are parts of Colorado where the need for these programs remains or has grown.
- The poverty threshold does not accurately reflect the cost of living in our state. As health care, housing and child care costs, among many others, continue to rise, there will be an increasing number of families living above the poverty level but unable to cover the costs of the goods and services they need to get by.
As a state, we must continue to support programs and policies that provide relief to these families as they work to become self-sufficient and economically secure.
Note on data: While it’s common to see data from the five-year American Community Survey presented as a data point for a single year (2018 for example), it is important to keep in mind that the data represent a 5-year average of survey samples. The data for 2018 was collected between 2014-2018. This is done to ensure there is a large enough sample size for statistically valid results for geographic places (counties, cities/towns, etc.) with fewer than 65,000 residents. Effectively, this averaging results in a number that is more “smooth” than data reported in other Census Bureau surveys, as year-to-year changes are moderated by the results from the previous four years when the numbers are averaged. However, for ease of understanding we refer to the five-year estimates as data for 2018.
– By Charlie Brennan
